Gage rnr charts
daspi.plotlib.precast.GageRnRCharts(rnr_model, *, spread_accepted_limit=0.1, spread_rejected_limit=0.3, u_accepted_limit=0.15, stretch_figsize=False)
Bases: JointChart
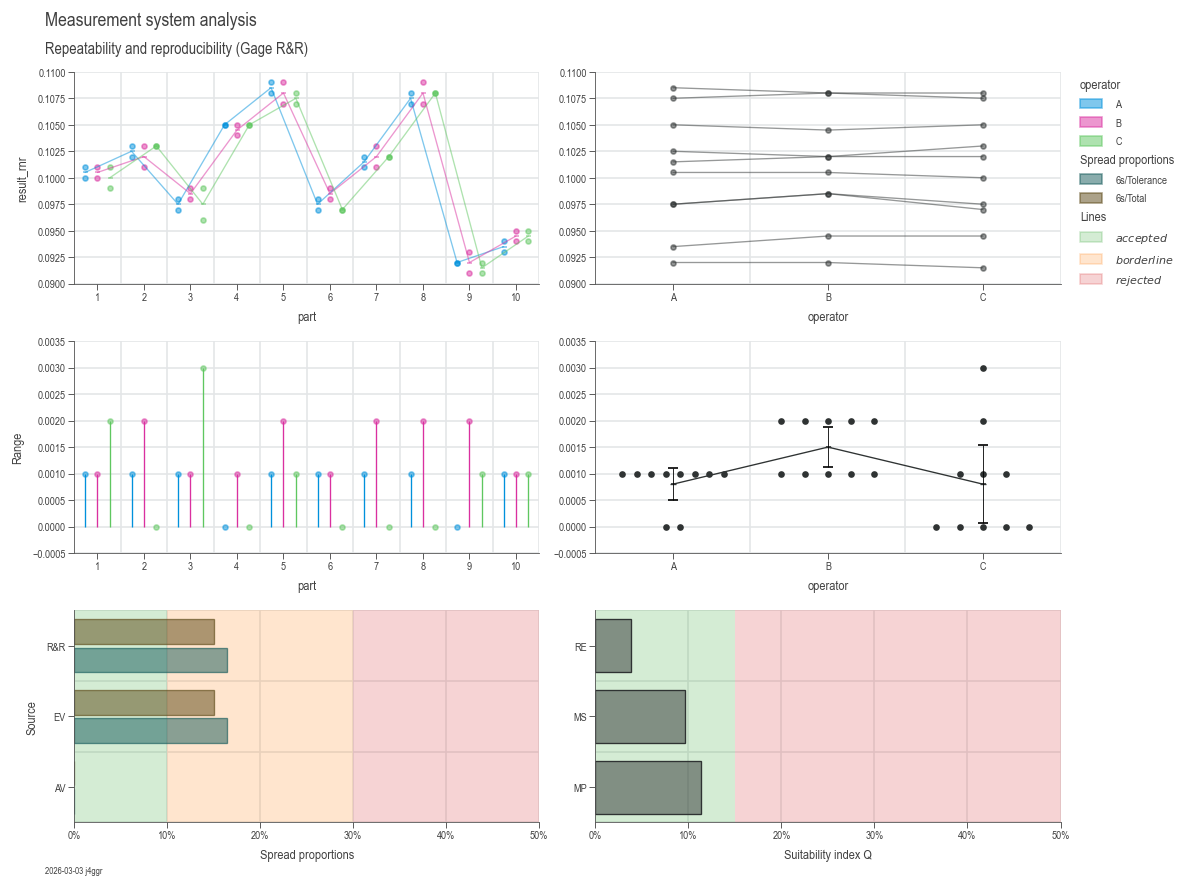
A class for visualizing the parameters of a GageRnR model.
| PARAMETER | DESCRIPTION |
|---|---|
rnr_model
|
The GageRnR model whose parameters will be visualized.
TYPE:
|
spread_accepted_limit
|
The maximum value for the the spread proportion where it is accepted. Default is 0.1 (10 %).
TYPE:
|
spread_rejected_limit
|
The minimum limit where the spread proportion is rejected. Default is 0.3 (30 %).
TYPE:
|
u_accepted_limit
|
The maximum value for the the u proportion where it is accepted. Default is 0.15 (15 %).
TYPE:
|
stretch_figsize
|
If True, the height and width of the figure are stretched based on the number rows and columns in the axes grid. If a float is provided, the figure size is stretched by the given factor. If a tuple of two floats is provided, the figure size is stretched by the given factors for the x and y axis, respectively. by default False.
TYPE:
|
Examples:
import daspi as dsp

df = dsp.load_dataset('grnr_layer_thickness')
gage = dsp.GageStudyModel(
    source=df,
    target='result_gage',
    reference='reference',
    u_cal=df['U_cal'][0],
    tolerance=df['tolerance'][0],
    resolution=df['resolution'][0])
model = dsp.GageRnRModel(
    source=df,
    target='result_rnr',
    part='part',
    gage=gage,
    u_av='operator')

chart = dsp.GageRnRCharts(model, stretch_figsize=True
    ).plot(
    ).stripes(
    ).label()
model
model = rnr_model
instance-attribute
The GageRnR model whose parameters are visualized.
spread_accepted_limit = spread_accepted_limit
instance-attribute
The maximum value for the the spread proportion where it is accepted (10 %).
spread_rejected_limit = spread_rejected_limit
instance-attribute
The minimum limit where the spread proportion is rejected (30 %).
u_accepted_limit = u_accepted_limit
instance-attribute
The minimum limit where the measuremen unsertainty proportion is rejected (15 %).
part
property
Column name of the part (unit under test) variable (read-only).
av_gv
property
Column name of the variable that identifies the operator for type 2 Gage R&R or the gage variate for type 3 Gage R&R (read-only).
plot()
Plot the GageRnR charts.
stripes()
Adds lines for the limits for the spread and uncertainties proportions.
label(info=False, **kwds)
Adds titles and labels to the charts generated by the
plot() method.
| PARAMETER | DESCRIPTION |
|---|---|
info
|
If
TYPE:
|
**kwds
|
Additional keyword arguments to be passed to the
DEFAULT:
|
| RETURNS | DESCRIPTION |
|---|---|
Self
|
The |