Gage study charts
daspi.plotlib.precast.GageStudyCharts(model, *, dist='norm', stretch_figsize=False)
Bases: JointChart
A class for visualizing the parameters of a GageStudy model.
| PARAMETER | DESCRIPTION |
|---|---|
model
|
The GageStudy model whose parameters will be visualized.
TYPE:
|
dist
|
The probability distribution use for creating feature data (the theoretical values). Default is 'norm'.
TYPE:
|
stretch_figsize
|
If True, the height and width of the figure are stretched based on the number rows and columns in the axes grid. If a float is provided, the figure size is stretched by the given factor. If a tuple of two floats is provided, the figure size is stretched by the given factors for the x and y axis, respectively. by default False.
TYPE:
|
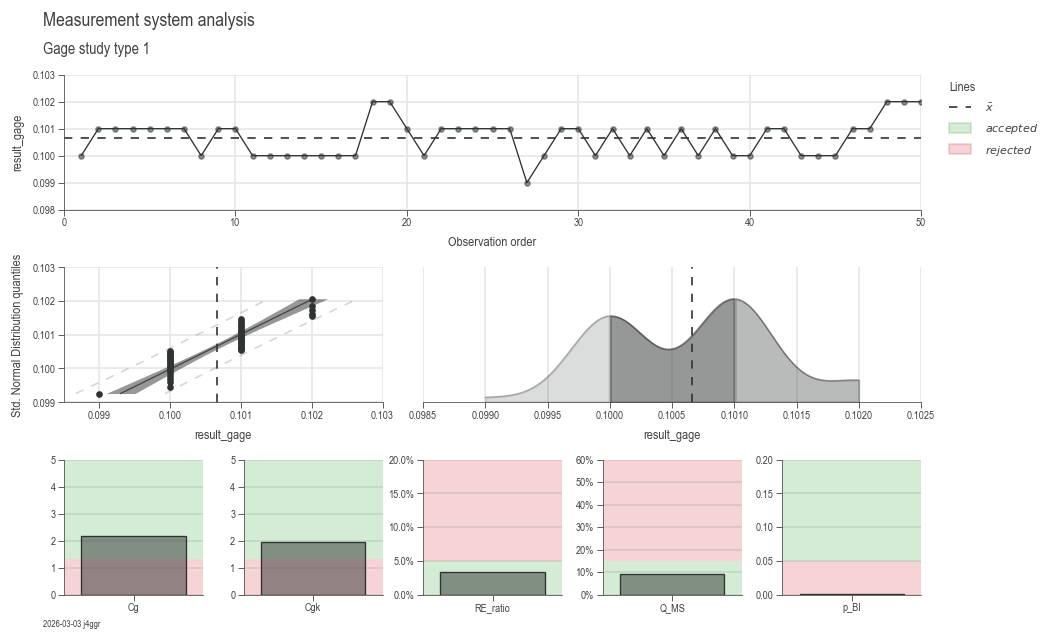
Examples:
Run the following command in a jupyter notebook to get the html
output of gage or you can also use print(repr(gage)) instead:
import daspi as dsp
df = dsp.load_dataset('grnr_layer_thickness')
gage = dsp.GageStudyModel(
    source=df,
    target='result_gage',
    reference='reference',
    u_cal=df['U_cal'][0],
    tolerance=df['tolerance'][0],
    resolution=df['resolution'][0],
    bias_corrected=True,)
chart = dsp.GageStudyCharts(gage, stretch_figsize=1.5).plot().stripes().label()
gage
model = model
instance-attribute
The GageStudy model whose parameters are visualized.
dist = dist
instance-attribute
The probability distribution use for creating feature data (the theoretical values).
has_multiple_references = source[reference].nunique() > 1
instance-attribute
Whether the GageStudy model has multiple references.
label(info=False, **kwds)
Adds titles and labels to the charts generated by the
plot() method.
| PARAMETER | DESCRIPTION |
|---|---|
info
|
If
TYPE:
|
**kwds
|
Additional keyword arguments to be passed to the
DEFAULT:
|
| RETURNS | DESCRIPTION |
|---|---|
Self
|
The |