Pairwise matrix charts
daspi.plotlib.precast.PairwiseMatrixCharts(source, features, hue='', stretch_figsize=False)
Bases: JointChart
A class for creating pairwise matrix charts.
This class extends the JointChart class and provides methods for
creating pairwise matrix charts. It allows you to visualize pairwise
relationships between features in a dataset.
| PARAMETER | DESCRIPTION |
|---|---|
source
|
The source data.
TYPE:
|
features
|
The features for which the pairwise matrix charts will be created.
TYPE:
|
hue
|
The hue variable for the charts, by default ''.
TYPE:
|
stretch_figsize
|
If True, the height and width of the figure are stretched based on the number rows and columns in the axes grid. If a float is provided, the figure size is stretched by the given factor. If a tuple of two floats is provided, the figure size is stretched by the given factors for the x and y axis, respectively. by default False.
TYPE:
|
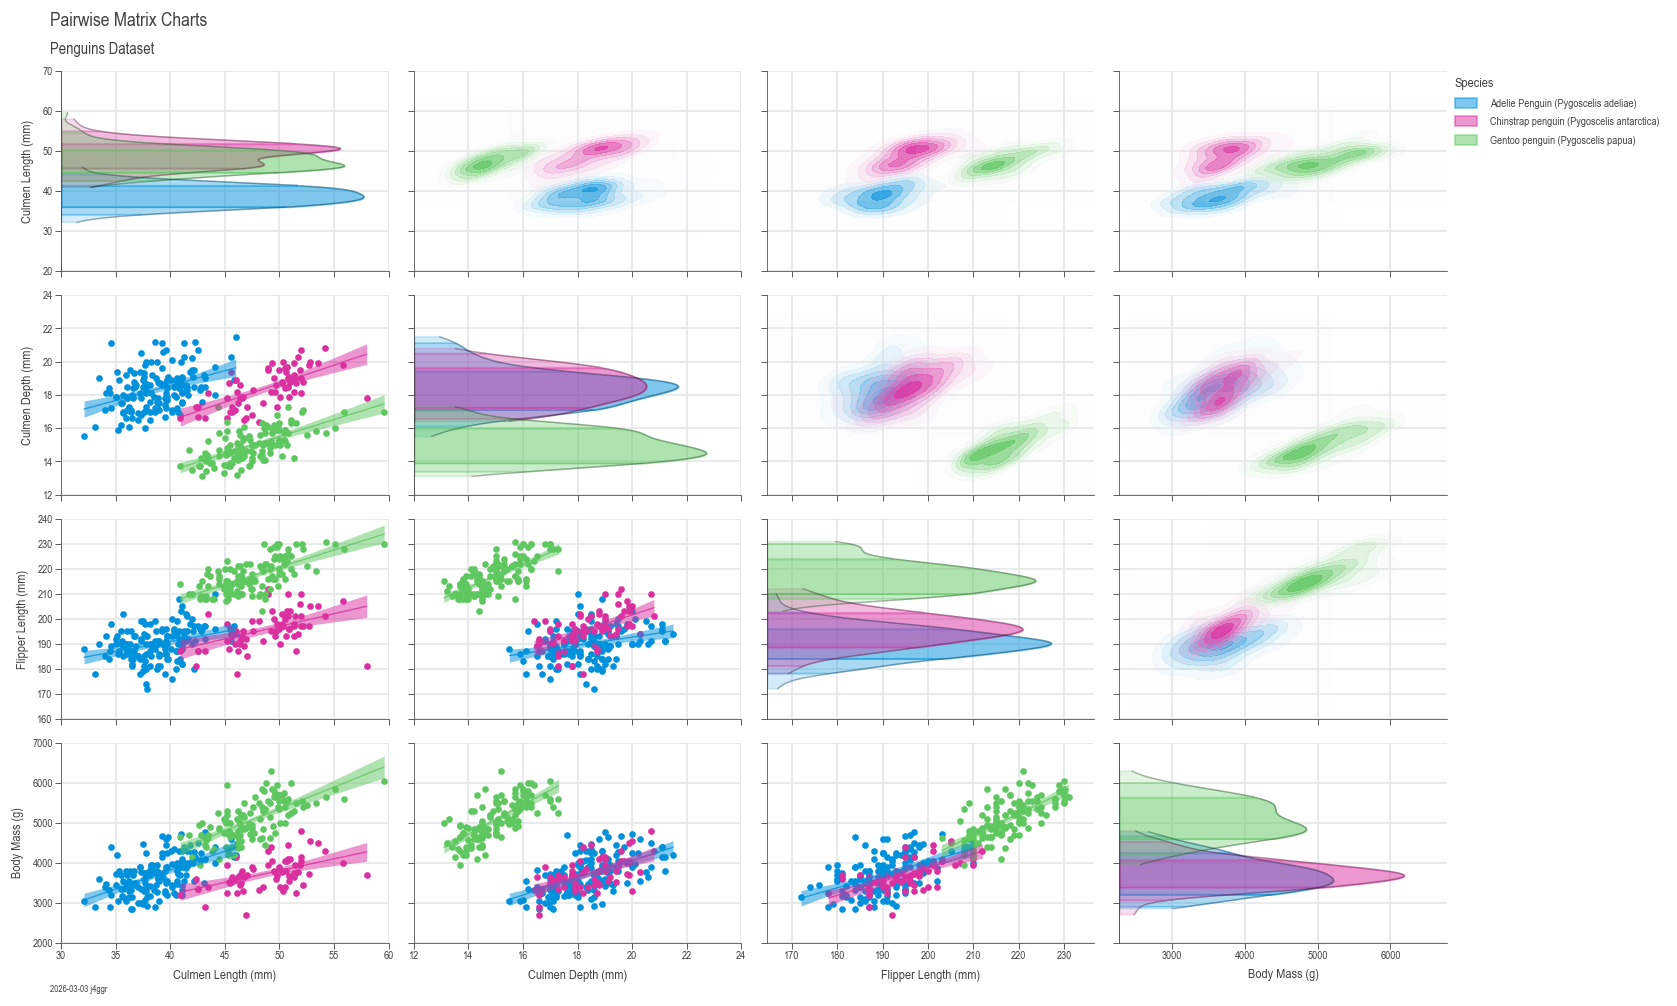
Examples:
import daspi as dsp
df = dsp.load_dataset('penguins')
features = (
    'Culmen Length (mm)',
    'Culmen Depth (mm)',
    'Flipper Length (mm)',
    'Body Mass (g)')
chart = dsp.PairwiseMatrixCharts(
    source=df,
    features=features,
    hue='Species',
    stretch_figsize=True
    ).plot(
    ).label(
        fig_title='Pairwise Matrix Charts',
        sub_title='Penguins Dataset',
        target_label=True,
        feature_label=True,
        info=True
    )
plot(*, diag_plot=GaussianKDE, lower_plot=LinearRegressionLine, upper_plot=GaussianKDEContour, kw_diag={'visible_spines': 'target', 'hide_axis': 'both'}, kw_lower=None, kw_upper=None)
Plot the pairwise matrix charts.
| PARAMETER | DESCRIPTION |
|---|---|
diag_plot
|
The type of plot to use for the diagonal subplots. If None,
the diagonal subplots will be skipped. Default is
:class:
TYPE:
|
lower_plot
|
The type of plot to use for the lower triangle subplots. If
None, the lower triangle subplots will be skipped. Default
is :class:
TYPE:
|
upper_plot
|
The type of plot to use for the upper triangle subplots. If
None, the upper triangle subplots will be skipped. Default
is :class:
TYPE:
|
kw_diag
|
Additional keyword arguments to be passed to the plotter for
the diagonal subplots. Default is
:obj:
TYPE:
|
kw_lower
|
Additional keyword arguments to be passed to the plotter for the lower triangle subplots. Default is None.
TYPE:
|
kw_upper
|
Additional keyword arguments to be passed to the plotter for the upper triangle subplots. Default is None.
TYPE:
|
label(*, fig_title='', sub_title='', feature_label=True, target_label=True, info=False)
Add labels and titles to the chart.
This method sets various labels and titles for the chart, including figure title, subplot title and additional information.
| PARAMETER | DESCRIPTION |
|---|---|
fig_title
|
The main title for the entire figure, by default ''.
TYPE:
|
sub_title
|
The subtitle for the entire figure, by default ''.
TYPE:
|
feature_label
|
The label for the feature variable (x-axis). If set to True, the feature variable names will be used. If set to False or None, no label will be added. If a tuple of strings is provided, it will be used as the labels. Default is True.
TYPE:
|
target_label
|
The label for the target variable (y-axis), by default ''. If set to True, the target variable name will be used. If set to False or None, no label will be added. If a tuple of strings is provided, it will be used as the labels. Default is True.
TYPE:
|
info
|
Additional information to display on the chart. If True, the date and user information will be automatically added at the lower left corner of the figure. If a string is provided, it will be shown next to the date and user, separated by a comma. By default, no additional information is displayed.
TYPE:
|