Process capability analysis charts
daspi.plotlib.precast.ProcessCapabilityAnalysisCharts(source, target, *, spec_limits, hue='', dist='norm', error_values=(), strategy='norm', agreement=6, possible_dists=DIST.COMMON, stretch_figsize=False)
Bases: JointChart
A class for creating process capability analysis charts.
This class extends the JointChart class and provides methods for
creating process capability analysis charts. It allows you to
visualize process capability analysis data and perform various
analysis tasks.
| PARAMETER | DESCRIPTION |
|---|---|
source
|
The source data.
TYPE:
|
target
|
The target (dependant) variable.
TYPE:
|
spec_limits
|
The specification limits for the process capability analysis.
TYPE:
|
hue
|
The hue variable for the chart, by default ''.
TYPE:
|
dist
|
The probability distribution use for creating feature data (the theoretical values). Default is 'norm'.
TYPE:
|
error_values
|
If the process data may contain coded values for measurement errors or similar, they can be specified here, by default [].
TYPE:
|
strategy
|
Which strategy should be used to determine the control
limits (process spread):
-
TYPE:
|
agreement
|
Specify the tolerated process variation for which the control limits are to be calculated. - If int, the spread is determined using the normal distribution agreementσ, e.g. agreement = 6 -> 6σ ~ covers 99.75 % of the data. The upper and lower permissible quantiles are then calculated from this. - If float, the value must be between 0 and 1.This value is then interpreted as the acceptable proportion for the spread, e.g. 0.9973 (which corresponds to ~ 6 σ) by default 6
TYPE:
|
possible_dists
|
Distributions to which the data may be subject. Only continuous distributions of scipy.stats are allowed, by default DIST.COMMON
TYPE:
|
stretch_figsize
|
If True, the height and width of the figure are stretched based on the number rows and columns in the axes grid. If a float is provided, the figure size is stretched by the given factor. If a tuple of two floats is provided, the figure size is stretched by the given factors for the x and y axis, respectively. by default False.
TYPE:
|
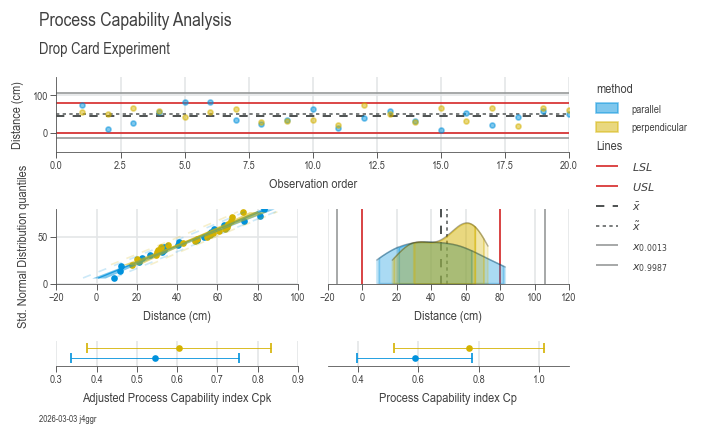
Examples:
import daspi as dsp

df = dsp.load_dataset('drop_card')
target = 'distance'

chart = dsp.ProcessCapabilityAnalysisCharts(
        source=df,
        target=target,
        spec_limits=dsp.SpecLimits(0, float(df.loc[0, 'usl'])),
        hue='method'
    ).plot(
    ).stripes(
    ).label(
        fig_title='Process Capability Analysis',
        sub_title='Drop Card Experiment',
        target_label='Distance (cm)',
        info=True)
spec_limits = spec_limits
instance-attribute
The specification limits for the process capability analysis.
dist = dist
instance-attribute
The probability distribution use for creating feature data (the theoretical values).
kw_estim = dict(error_values=error_values, strategy=strategy, agreement=agreement, possible_dists=possible_dists)
instance-attribute
Keyword arguments for the ProcessEstimator instances used for calculating the capability indices.
n_groups = source.groupby(hue).ngroups if hue else 1
instance-attribute
The number of hue groups in the source data.
processes()
Get a dictionary of ProcessEstimator instances that are used for calculating the capability indices.
| RETURNS | DESCRIPTION |
|---|---|
Dict[str, ProcessEstimator]
|
A dictionary where: - Keys: The hue categories or the target name if no hue is used. - Values: The corresponding ProcessEstimator instances. |
process_descriptions(exclude=())
Get a DataFrame containing the descriptions of each process.
This method generates a DataFrame that contains the descriptions of each process, excluding any specified columns.
| PARAMETER | DESCRIPTION |
|---|---|
exclude
|
Attributes to exclude from the summary statistics, by default ().
TYPE:
|
| RETURNS | DESCRIPTION |
|---|---|
DataFrame
|
A DataFrame containing the descriptions of each process. |
plot(**kwds_cpi)
Plot the process capability analysis charts.
This method plots the process capability analysis charts, including scatter plots, probability density functions, Gaussian kernel density estimation, and capability confidence intervals.
| PARAMETER | DESCRIPTION |
|---|---|
kwds_cpi
|
Additional keyword arguments for the capability confidence interval plot.
TYPE:
|
| RETURNS | DESCRIPTION |
|---|---|
Self
|
The |
stripes(*, mean=True, median=True, control_limits=True)
This method adds stripes to the process capability analysis charts, including mean, median, control limits and specification limits.
| PARAMETER | DESCRIPTION |
|---|---|
mean
|
Whether to add a line for the mean, by default True.
TYPE:
|
median
|
Whether to add a line for the median (if applicable), by default True.
TYPE:
|
control_limits
|
Whether to add lines for the control limits (if applicable), by default True.
TYPE:
|
| RETURNS | DESCRIPTION |
|---|---|
Self
|
The |
label(*, fig_title='', sub_title='', feature_label=(), target_label='', info=False)
Label the process capability analysis charts.
This method labels the process capability analysis charts with custom labels and titles.
| PARAMETER | DESCRIPTION |
|---|---|
fig_title
|
The title of the figure, by default ''.
TYPE:
|
sub_title
|
The subtitle of the figure, by default ''.
TYPE:
|
feature_label
|
The labels for the features. If not provided, default labels will be used. The tuple should contain five elements. By default, the labels are: ('Observation order', '', 'Quantiles of standard normal distribution', '', '')
TYPE:
|
target_label
|
The label for the target variable, by default ''.
TYPE:
|
info
|
Whether to display information about the chart. If True, the information will be displayed. If a string is provided, it will be used as the title of the information box. By default, the information is not displayed.
TYPE:
|
| RETURNS | DESCRIPTION |
|---|---|
Self
|
The |